
This section presents an overview of a case study in the use of MetricsAnalysis for IBM Db2 in analysing and tuning an IBM Db2 environment and application.
The application in the case study is MetricsAnalysis for IBM Db2, which uses Db2 10.5 for Data Warehouse, Data Mart and Reporting purposes.
This case study documents the use of MetricsAnalysis for IBM Db2 to analyse the MetricsAnalysis application, to determine if there are ways in which Db2 can be reconfigured to facilitate the processing of MetricsAnalysis for IBM Db2.
A copy of the case study can be obtained by completing the Case Study Download form.
Executive Summary
The system setup equated to 8 CPUs, at 100 processor value units (PVUs) per CPU = 800 PVUs, to support the workload.
The case study consisted of 3 phases of cost cutting being executed and a final phase using the risk management process to provide assurance that maximum benefit had been achieved.
The end result was a 69.76% reduction in CPU that equated to an equivalent PVU reduction from 800 to 300, a real saving in ongoing costs.
In addition to the cost saving there with a 61.78% increase in throughput, meaning that more work was being performed whilst sustaining a reduction in PVUs.
Change Analysis
The output from each phase is a document detailing the analysis, highlighting issues, providing recommendations and an implementation plan.
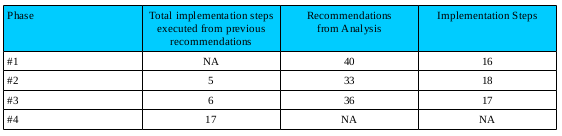 For each phase the number of changes implemented from the previous phase, the number of recommendations presented from the current phase and the total number of implementation steps for the current phase recommendations is shown,
- #1 represents the data from the first collect phase
- #2 represents the data from the second collect phase, which includes the effects of changes that were applied from the #1 recommendations
- #3 represents the data from the third collect phase, which includes the effects of changes that were applied from the #2 recommendations
- #4 represents the data from the fourth collect phase, which includes the effects of changes that were applied from the #3 recommendations
Results
The results use the risk management process to compare the Workload, CPU, memory and IO used across the phases. An example is presented below.
Workload
First, an analysis of the workload, as defined by the number of statements issued by the applications, is performed.

There is a considerable increase in the number of SQL statements between phase #1 and #4.
CPU
The total CPU for the workload has reduced by 69.76%

This reduction in CPU is achieve alongside a 61.78% increase in "All SQL Statements" and an 82.7% increase in UID (Update/Insert/Delete) statements between phases #1 and #4.
Memory
The memory used for the workload has increased by 27.15%, mainly as a result of memory configuration changes.

For a small increase in memory, a considerable reduction in CPU consumption has been achieved.
Setting a large enough memory allocation for key component areas will result in a reduction in CPU, a consistent behaviour in SQL execution and a better end user experience.